Advanced AC and DC Transmission Systems
Coursework -Part B

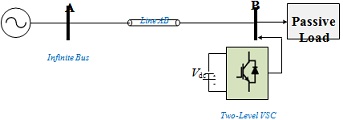
Fig. 1: The benchmark AC transmission network Table I: Initial Specifications of AC Transmission Network
Bus A is the infinite (slack) bus 1 pu
Reactance between Buses A and B 0.5 pu
X/R ratio 10
Initial active power of passive load at Bus B 0.8 pu
Range of load active power variation at bus B 0.5 - 1.1pu
Base voltage 220kV
Base Power 500MVA
Power frequency 50Hz
Power factor 0.9
Question 1
Based on the above described system and with the aid of the available exercise MATLAB files:
(a) Calculate the impedance of line AB in Ohms.
(b) Calculate Loads B active and reactive powers in MW and MVAR, respectively.
(c) Verify part (b) via simulation.
(b) Use three simulation case studies to evaluate how the variation of Line AB impedance may affect it Bus B voltage profile. Comment on the results.
(e) Use simulation three case studies to estimate the capacitance value that should be added (not shown in Fig.1) to regulate Bus B between 0.9-1.05pu. Comment on the results.
(f) [Theoretical] To regulate the voltage at bus B within the range of 0.9-1.05pu, describe two methods that can perform the task other than the fixed capacitor used in part(e). Your answer must include the following:
Schematic diagrams, academic references and which method you will prefer and why. No Simulations are required.
Question 2 Consider the VSC generic average model benchmark, shown in Fig. 2:

Fig. 2: VSC generic average model installed at Bus B
(a) [Theoretical] Using block diagram, briefly explain the use of Phase Locked Loop (PLL).
(b) Using appropriate simulation, show how to use the PLL to generate d-q frame voltages and currents at bus B.
(c) Using appropriate simulation, Based on the d-q frame used in (b), verify the active and reactive power calculations of load B.
(d) [Theoretical] If a detailed two-level VSC, see Fig. 3, is used show how the active and reactive powers are controlled by generating the two-level VSC IGBT gating signals.
Support your answer with academic references and illustrative diagrams.

Fig. 3: Two-level detailed VSC installed at Bus C Smart Grids and Sustainable Energy Systems